The Subscription Analytics page gives you a real-time overview of how your subscription business is performing. It covers revenue, subscriber activity, churn, and a per-plan breakdown.
To access it, go to your dashboard and navigate to Subscription > Subscribers. Then, click on the “View Full Analytics” button at the top right.
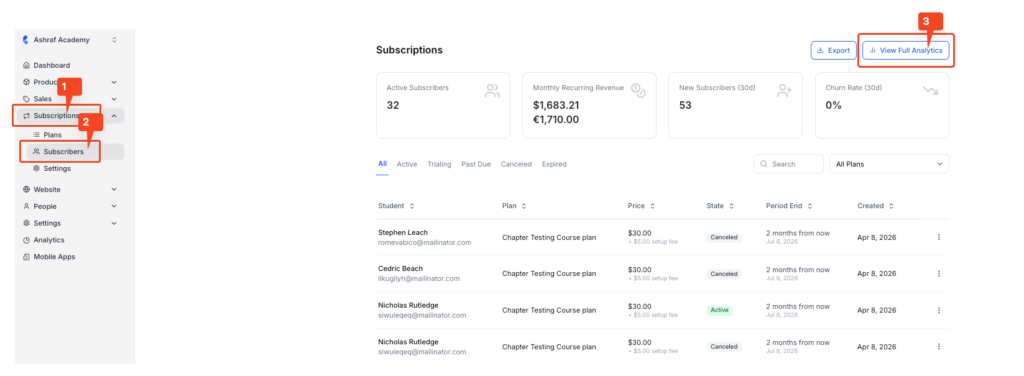
On the new screen, you will have access to the subscription analytics dashboard.
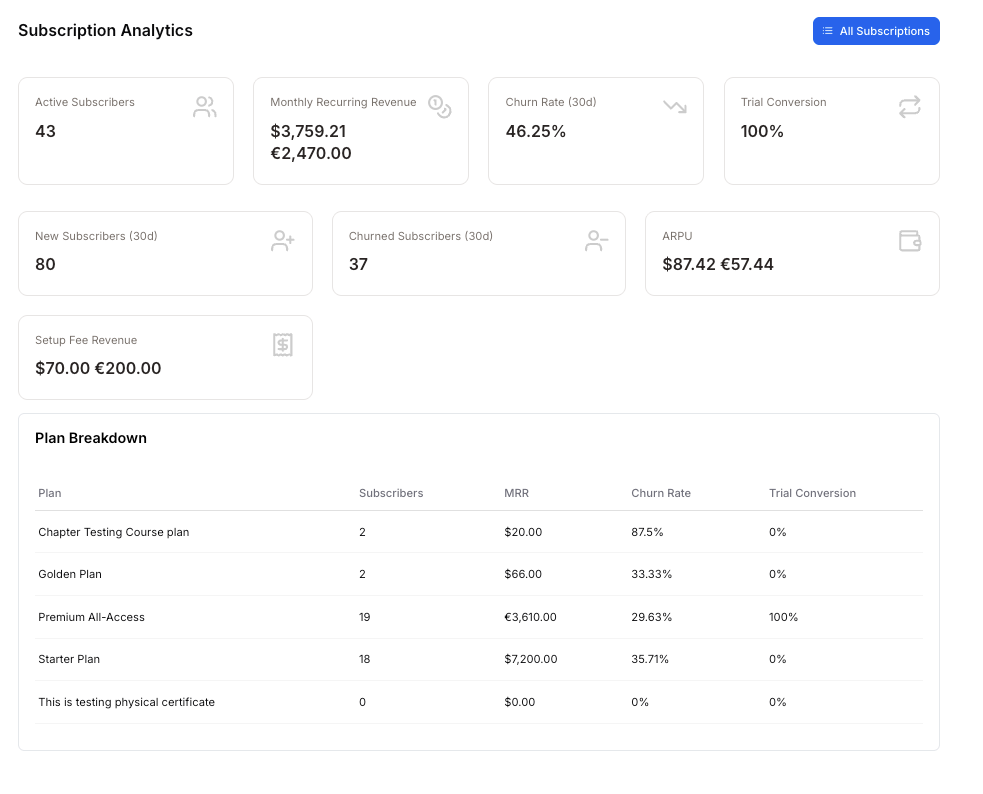
The top section displays eight key metrics that summarise your subscription performance across all plans.
- Active subscribers show the total number of students who currently have a live, paid subscription across all your plans.
Use this as your baseline audience size. A steady increase here signals healthy growth; a drop may indicate a retention issue worth investigating.
- Monthly recurring revenue (MRR) is the total predictable revenue your active subscriptions generate each month. The amount will be displayed according to the currency selected at the time of plan creation.
This is your most important revenue signal. It reflects what you can reliably expect to earn each month based on current subscribers, excluding one-time payments like setup fees.
- Churn rate (30d) shows the percentage of subscribers who cancelled or did not renew their subscription in the last 30 days.
A low churn rate (close to 0%) means students are staying. A high churn rate means students are leaving faster than they’re joining, which directly impacts your MRR. Monitoring this over time helps you catch problems early.
- Trial conversion is the percentage of students who started a free trial and went on to become paying subscribers.
A high conversion rate (e.g., 100%) means your trial experience is compelling, and students see enough value to pay. A low rate suggests your trial length, onboarding, or offer may need revisiting.
- New subscribers (30d) is the number of students who started a new subscription in the last 30 days.
This reflects the effectiveness of your recent marketing and sales activity. Compare it against churned subscribers to understand whether your subscriber base is growing or shrinking overall.
- Churned subscribers (30d) is the number of subscribers who left in the last 30 days.
If this number is higher than the number of new subscribers, your net subscriber count is declining. Use this alongside churn rate to identify which plans are losing the most students and take action accordingly.
- ARPU (average revenue per user) is the average amount of revenue each active subscriber generates, shown in both USD and EUR.
A higher ARPU means each subscriber is contributing more to your revenue. You can increase ARPU by upselling students to higher-tier plans or adding value to existing ones.
- Setup fee revenue is the total one-time setup fees collected from subscribers across all plans, shown in both USD and EUR.
This is separate from your MRR and represents non-recurring income. It’s useful for understanding the upfront revenue generated when students first join a plan.